
Reporting: Tableau
Course Overview
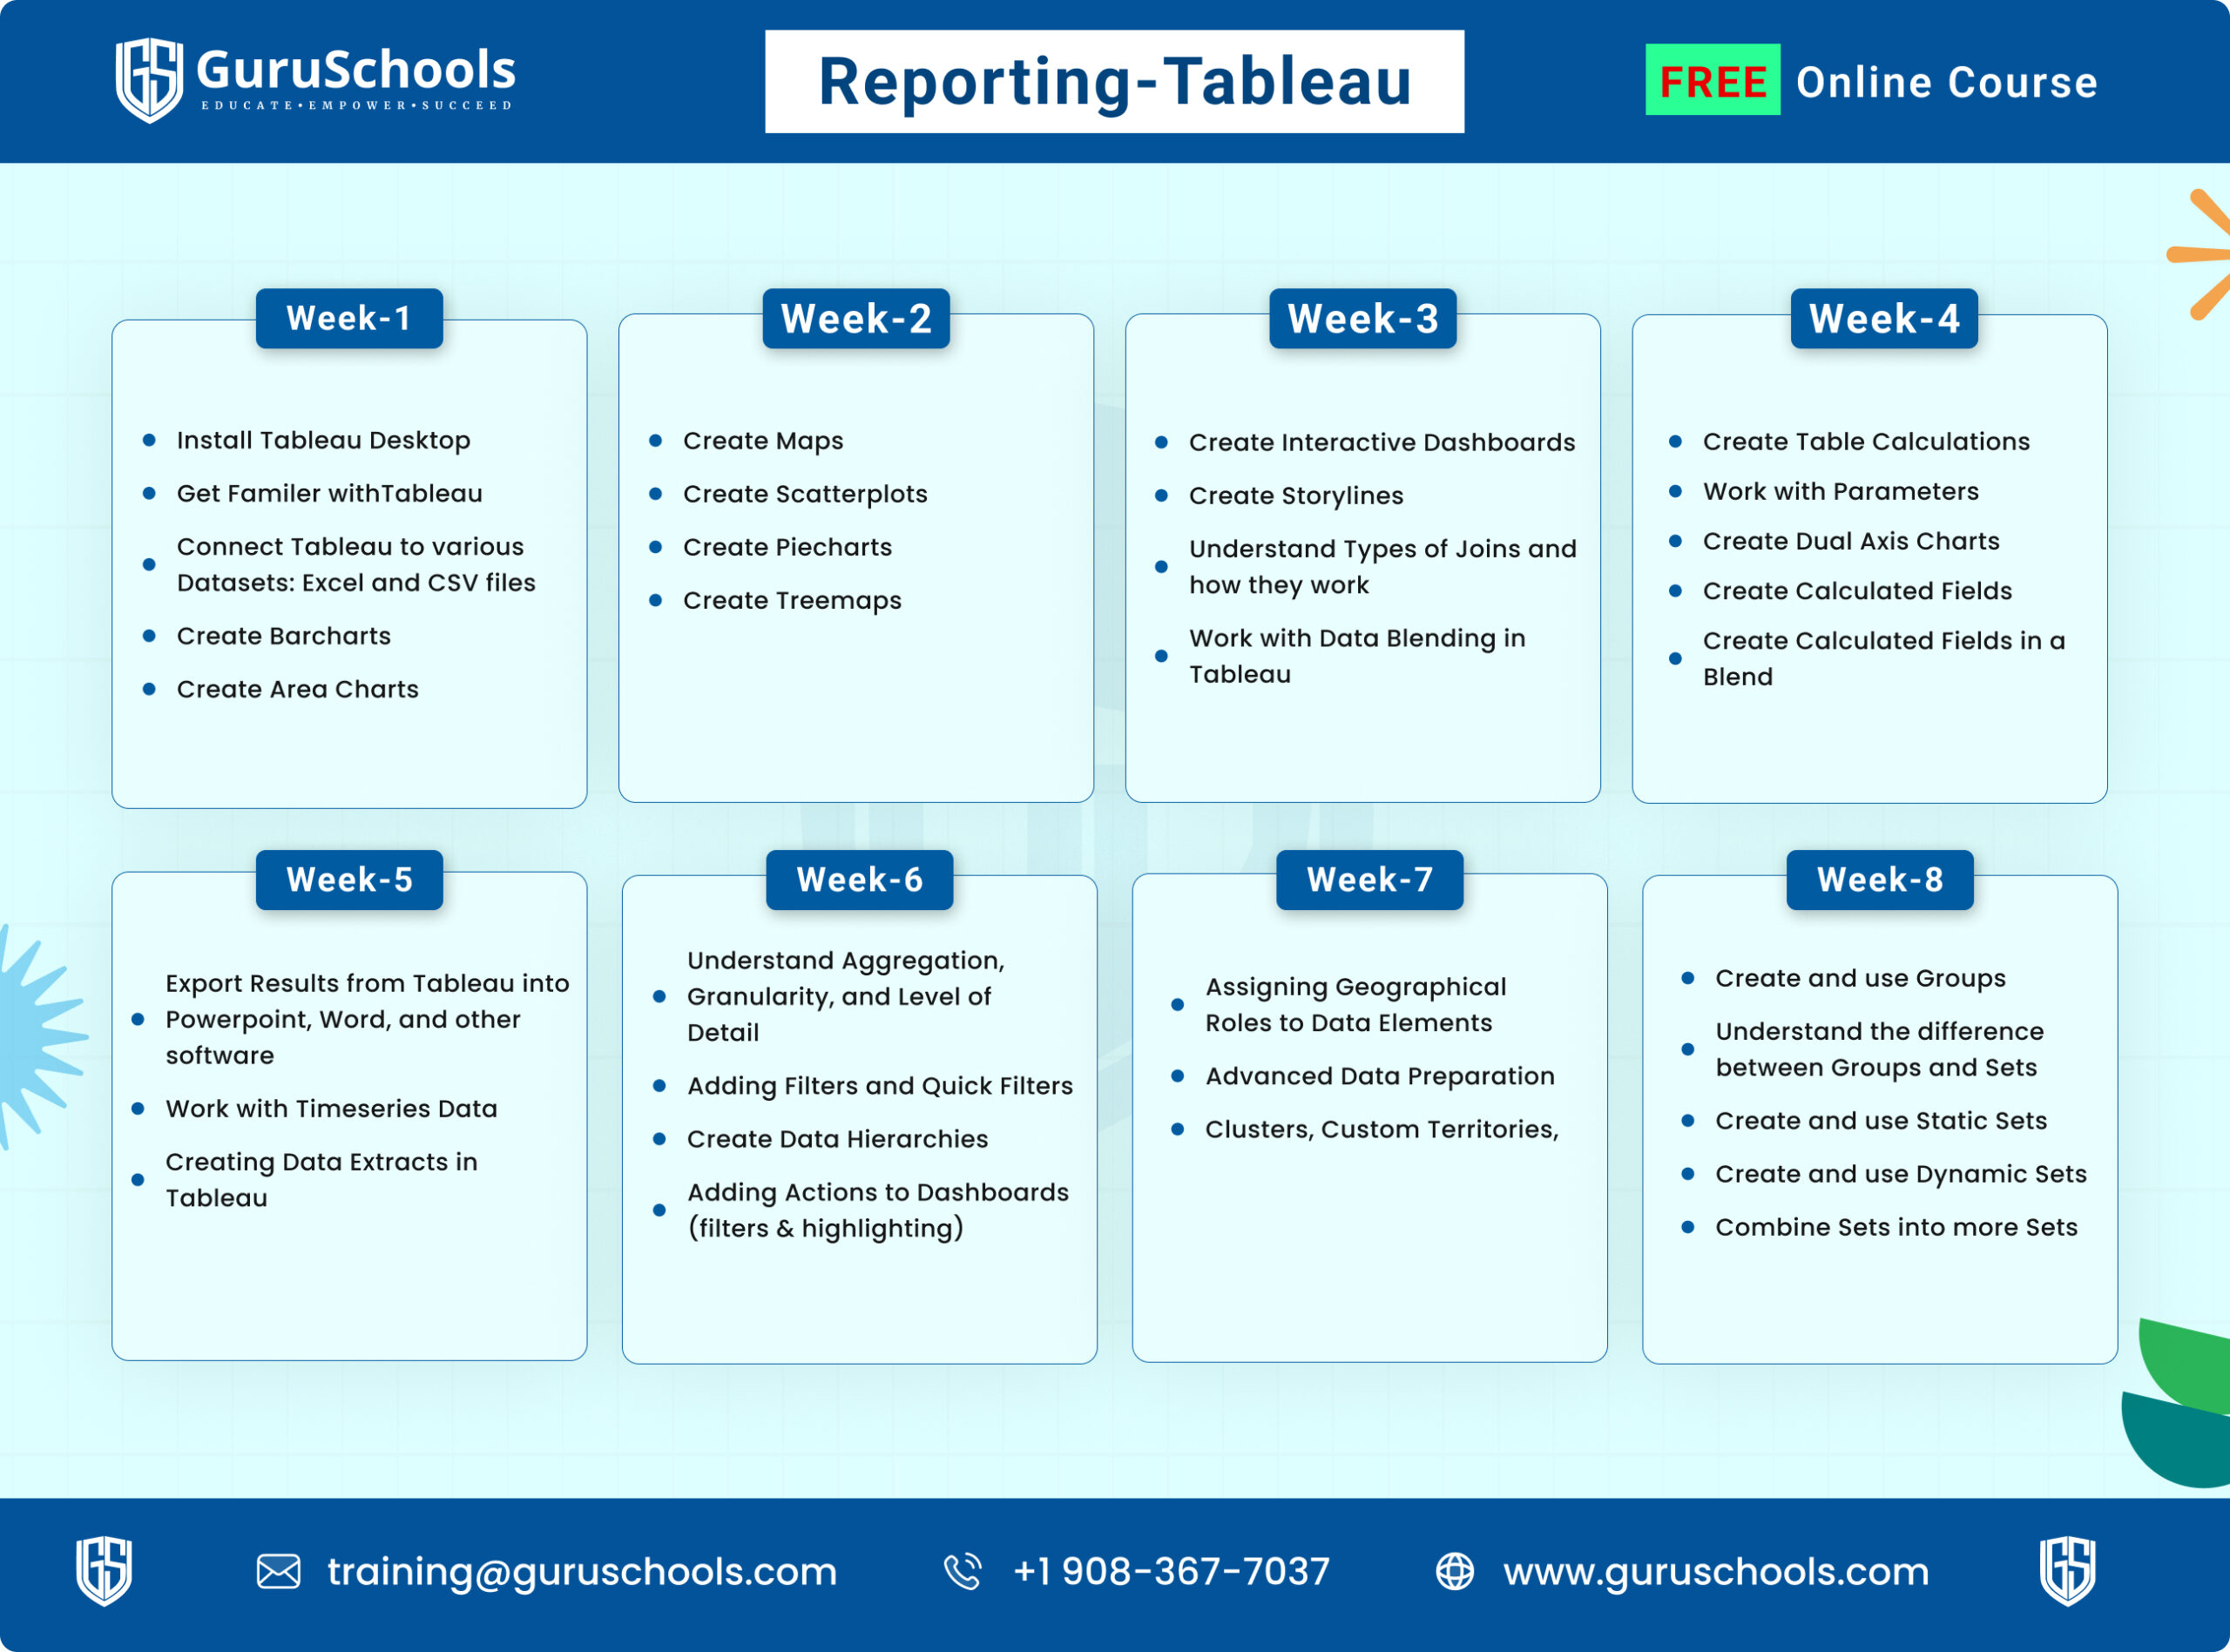
Course Curriculum
Week 1: Introduction to Tableau & Data Visualization
-
Install Tableau Desktop
-
Get Familiar with Tableau
-
Connect Tableau to Various Datasets: Excel and CSV files
-
Create Bar charts
-
Stack Bar Chart
-
Create Area Charts
-
Create Maps
Week 2: Tableau Interface & Data Connections
-
Create Scatter Plots
-
Create Pie Charts
-
Create Tree maps
-
Donut Chart
Week 3: Data Preparation & Transformation
-
Interactive Dashboards & Storylines
-
Understanding Types of joins and how they work
-
Work with Data Blending in Tableau
-
Table Calculations
-
String, Int & Date functions
Week 4: Charts, Graphs & Visual Analytics
-
Parameters & Filters
-
Dual Axis charts
-
Create Calculated fields
-
Work with Time series Data
Week 5: Filters, Parameters & Calculated Fields
-
Data Extracts in Tableau
-
Understanding of Aggregation, Granularity and LOD
-
Adding Filters & Quick Filters
-
Data Hierarchies
Week 6: Dashboards, Storyboards & Interactive Reports
-
Adding Action to Dashboards (Action filters)
-
Assigning Geographical roles to Data elements
-
Advanced Data Preparation
-
Clusters & Custom territories
Week 7: Advanced Tableau Concepts & Real-Time Projects
-
Use of Groups & Set
-
Dynamic & Static Sets
-
Combine Sets into more sets
Week 8: Tableau Server, Publishing & Interview Preparation
-
A tour of Tableau Server
-
Export results from Tableau into PowerPoint, PDF, word etc.
-
Manage Subscriptions, Refresh Schedule
About This Course:
- Access to Training Video
- Certificate of completion
- Resume Preparation
- Vendor Interviews
- Client Interviews
- Project Support
$1,000.00
Hi, Welcome back!