Reporting: Microsoft Power BI
Course Overview
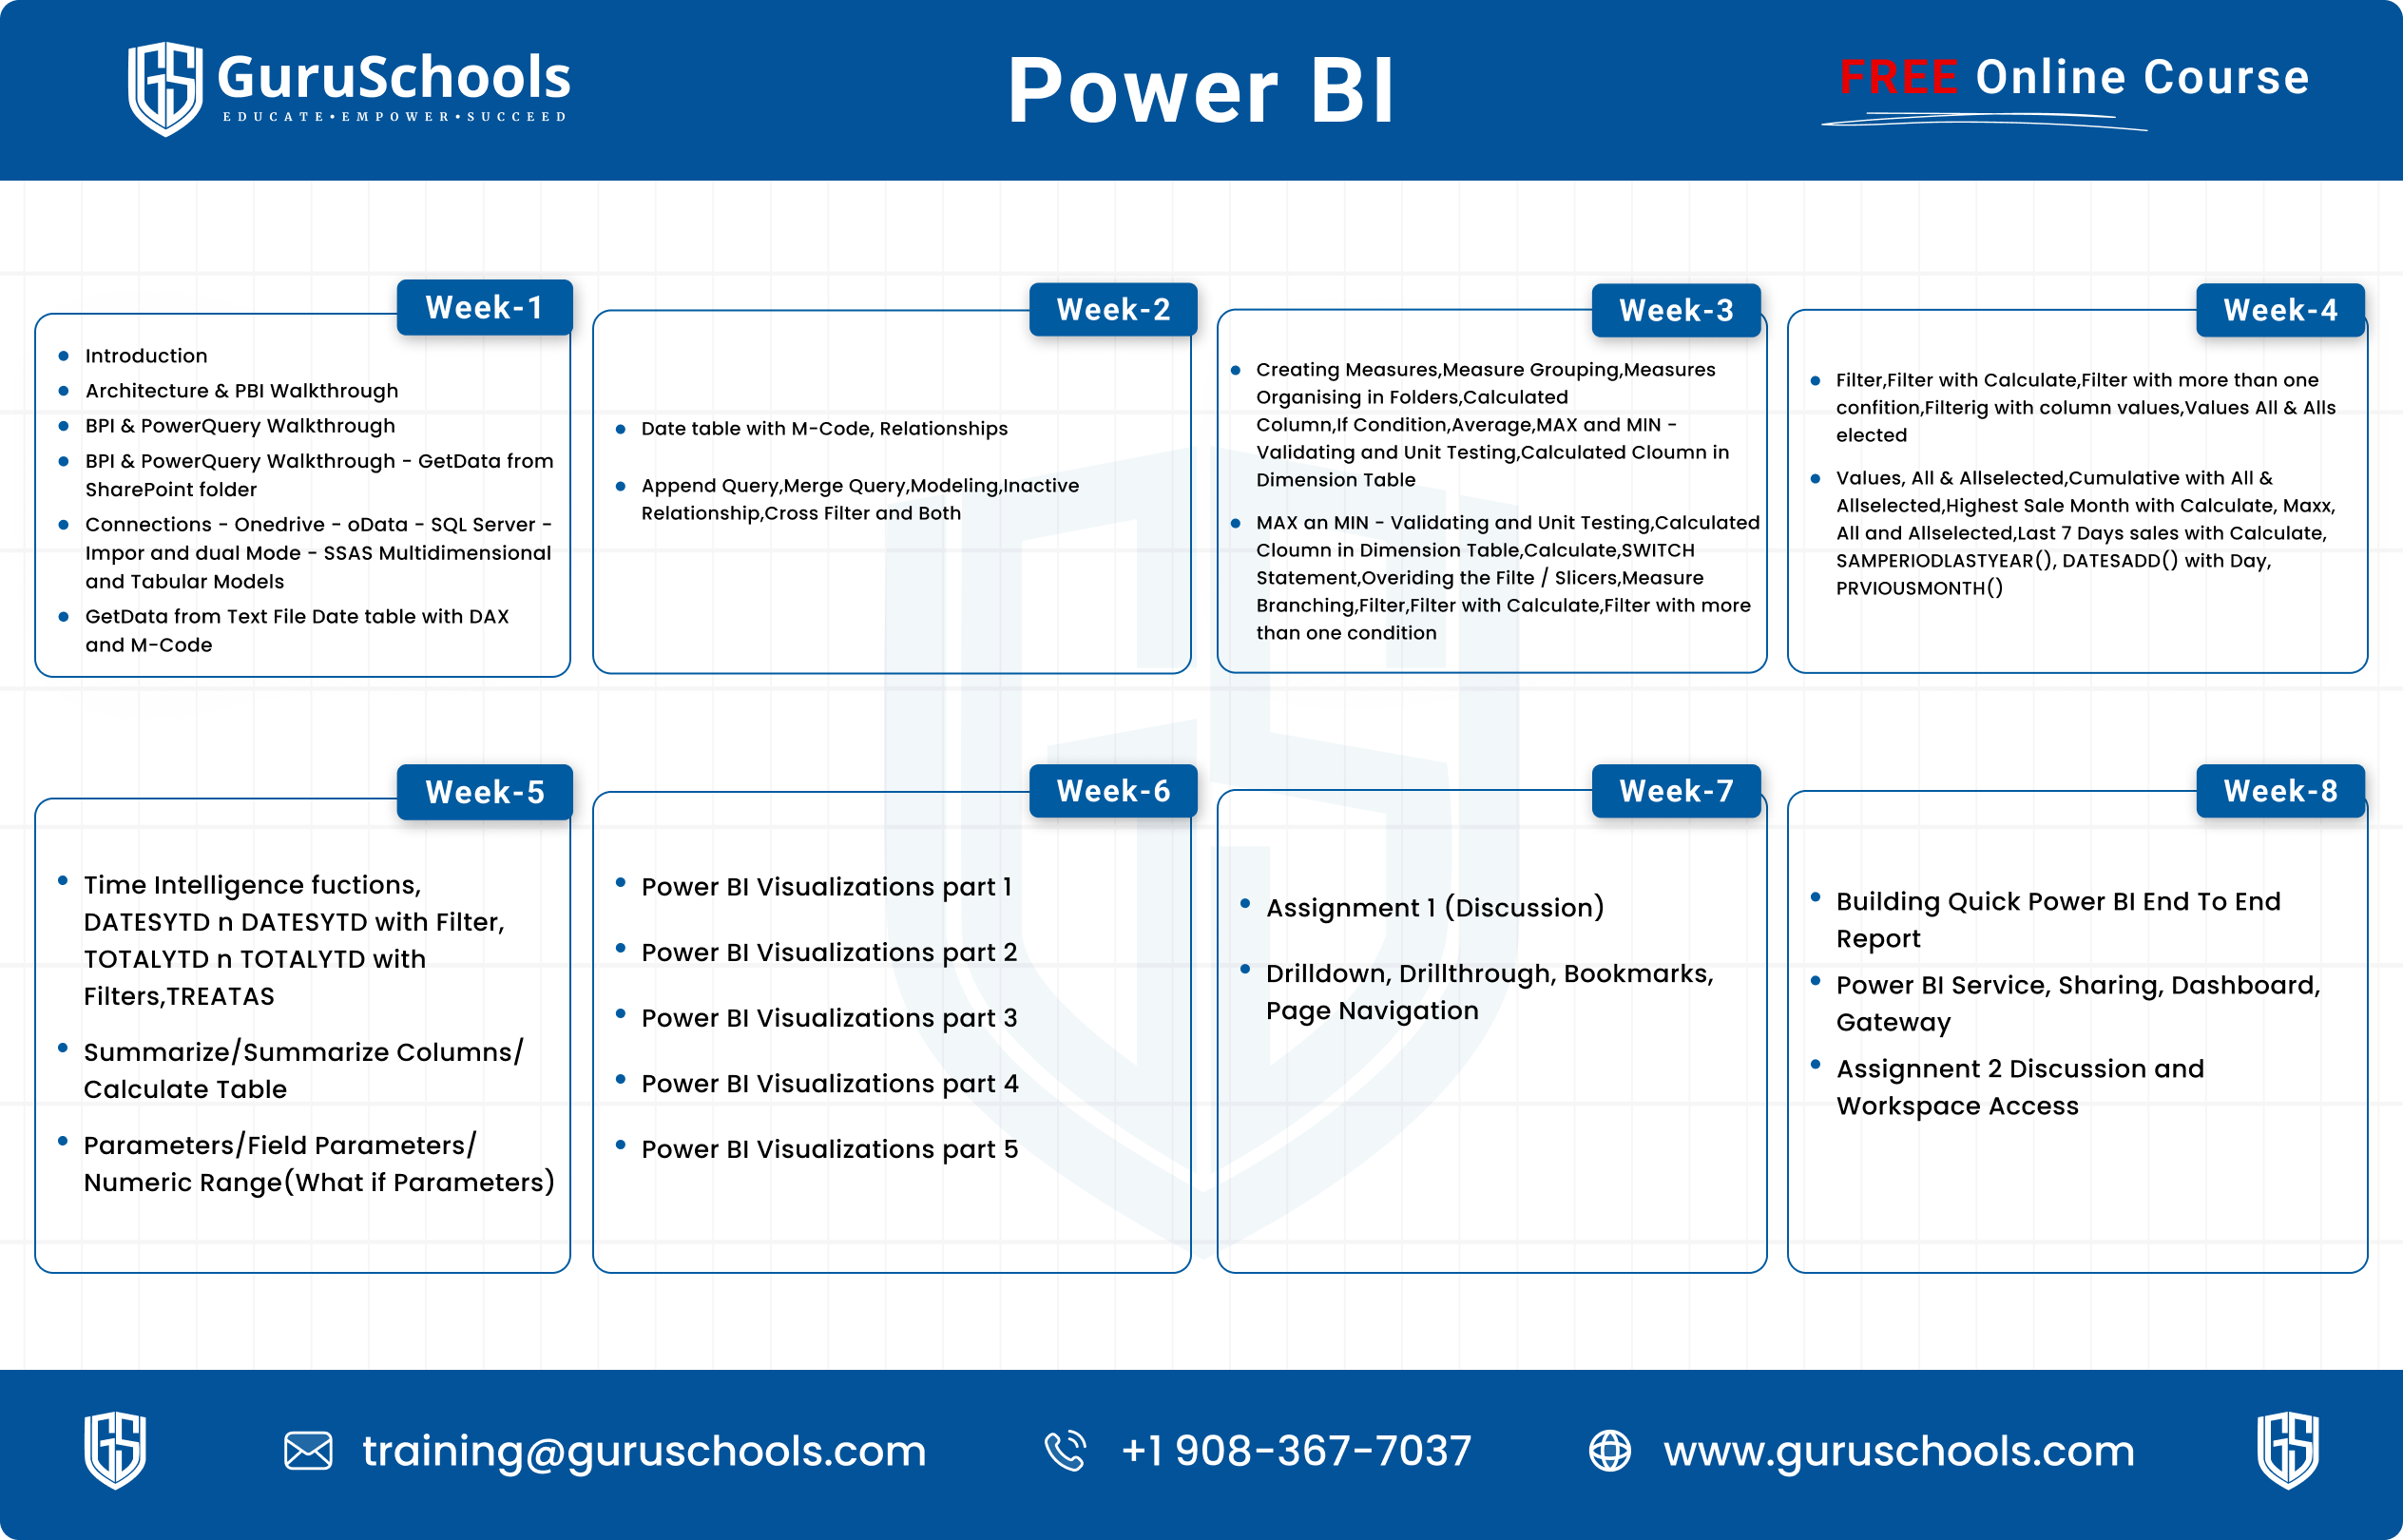
Course Curriculum
Week 1: Introduction to Power BI
-
What is Power BI: Understanding Power BI as a powerful business analytics tool developed by Microsoft for data visualization and analysis.
-
Why Power BI: Exploring the benefits of using Power BI for data-driven decision-making, including its intuitive interface and robust features.
-
How to Install Power BI: Step-by-step guidance on downloading and installing Power BI Desktop for local use or accessing Power BI Service online.
-
Power BI Architecture: Introduction to the architecture of Power BI, including its components such as Power BI Desktop, Power BI Service, and Power BI Gateway.
Week 2: Power BI Workflow and Data Views
-
Stages of Power BI Lifecycle: Understanding the different stages of the Power BI lifecycle, from data acquisition to report distribution.
-
Workflow of Power BI Desktop: Exploring the typical workflow within Power BI Desktop, including data loading, transformation, modeling, and visualization.
-
Data View, Report View, Model View: Familiarizing with the three main views in Power BI Desktop for managing data, creating reports, and building data models.
-
Getting Data Using Excel: Learning how to import data into Power BI from Excel spreadsheets.
-
Exploring Power BI Workflow and Interface: Further exploration of Power BI’s workflow and interface for effective data analysis and visualization.
Week 3: Data Acquisition from Various Sources
-
Getting Data from Various Sources: Exploring the diverse range of data sources that Power BI can connect to for data import.
-
Connecting to CSV files: Learning how to import data from CSV files into Power BI for analysis.
-
OData Northwind Database: Connecting to OData Northwind Database as a sample database for practice.
-
IMDB Web: Exploring the process of extracting data from the IMDB website using Power BI.
-
Google Sheets: Understanding how to import data from Google Sheets into Power BI for analysis.
Week 4: Connecting to SharePoint and SQL Server
-
Connecting to SharePoint Online Data: Understanding how to connect Power BI to SharePoint Online to access data stored in SharePoint.
-
SharePoint vs OneDrive comparison: Differentiating between SharePoint and OneDrive for data storage and integration with Power BI.
-
Connecting to SQL Server Database: Learning to connect Power BI to SQL Server databases for importing data.
-
Understanding Import vs Direct Query Method: Understanding the differences between importing data into Power BI and using a direct query method for real-time data analysis.
-
Checking Direct Query Impact using SQL Profiler: Exploring how to use SQL Profiler to monitor and analyze the impact of direct queries on SQL Server databases.
Week 5: Power Query Editor and Transformations
-
All about Power Query Editor: Introduction to Power Query Editor for data transformation and shaping.
-
Transformations Under Home Ribbon: Exploring various transformation options available under the Home ribbon in Power Query Editor.
-
Manage Columns, Reduce Rows: Learning how to manage columns and reduce unnecessary rows in Power Query Editor.
-
Sorting, Split Column etc.: Understanding sorting and splitting column data for effective data manipulation in Power Query Editor.
-
Power Query Editor Features: Exploring additional features and functionalities of Power Query Editor for advanced data transformations.
Week 6: Advanced Data Manipulation
-
How and When to Merge Queries: Understanding the scenarios and techniques for merging queries in Power BI.
-
Using Append Queries: Learning how to append multiple queries in Power BI for combined analysis.
-
Combine Files from a Folder: Exploring how to combine multiple files from a folder into a single dataset in Power BI.
-
Data Source Settings: Understanding and managing data source settings in Power BI for efficient data retrieval.
-
Merging, Appending & Combine Transformations: Further exploration of merging, appending, and combining transformations for advanced data manipulation in Power BI.
Week 7: Data Analysis Techniques
-
Data Manipulation Techniques: Exploring various techniques for manipulating data in Power BI, including filtering, sorting, and grouping.
-
Parameters for dynamic control: Learning how to use parameters in Power BI for dynamic control over data analysis.
-
Fill Up/Down for data population: Understanding how to use fill up/down techniques to populate missing data in Power BI.
-
Detecting data types and replacing values: Exploring methods for detecting data types and replacing values in Power BI datasets.
-
Pivot and Unpivot transformations: Understanding how to use pivot and unpivot transformations to reshape data for analysis in Power BI.
Week 8: DAX Fundamentals
-
Data Analysis Techniques: Introduction to various data analysis techniques in Power BI using Data Analysis Expressions (DAX).
-
Column from Examples, Invoke Custom Column: Exploring how to create new columns based on examples and invoke custom columns using DAX.
-
Column Quality Assessment: Learning techniques for assessing the quality of columns in Power BI datasets.
-
Column Distribution Analysis: Analyzing the distribution of data within columns using DAX.
-
Column Profiling: Profiling columns to understand their characteristics and distributions in Power BI datasets.
Week 9: Advanced DAX and Data Modeling
-
More Data Transformations: Exploring additional data transformation techniques using DAX in Power BI.
-
Creating Conditional Column: Learning how to create conditional columns based on specific criteria using DAX.
-
Understanding Query Dependencies: Understanding the dependencies between queries and data models in Power BI.
-
Using Merge Columns, Parse etc: Exploring advanced data manipulation techniques using DAX functions like Merge Columns and Parse.
-
Understanding M Query/M Code & creating a Calendar Table: Introduction to M Query/M Code and creating a calendar table for time-based analysis in Power BI.
Week 10: DAX Functions and Time Intelligence
-
Data Analysis Expressions (DAX): Understanding the fundamentals of DAX functions and their role in Power BI data analysis.
-
Setting up Foundation: Establishing the foundation for DAX calculations and expressions in Power BI.
-
Understanding filter context in DAX: Exploring the concept of filter context and its importance in DAX calculations.
-
DAX Syntax and operators: Learning the syntax and operators used in DAX expressions for data manipulation.
-
Creating measures in Power BI: Creating calculated measures using DAX to perform calculations and aggregations in Power BI reports.
Week 11: Visualizations in Power BI
-
Visualizations in Power BI: Introduction to the importance of visualizations in data analysis and reporting in Power BI.
-
Creating basic visuals like bar charts, line charts, and pie charts: Exploring the process of creating basic visualizations using different chart types in Power BI.
-
Customizing visual properties like colors, axes, and labels: Learning how to customize the appearance of visualizations in Power BI for better presentation.
-
Formatting options for visuals: Exploring various formatting options available for enhancing the visual appeal of Power BI reports.
-
Creating slicers for dynamic filtering and data exploration: Understanding how to create slicers in Power BI for interactive filtering and exploration of data.
Week 12: Collaboration, Sharing, and Final Discussions
-
Overview of Power BI Service and its features: Introduction to Power BI Service and its features for sharing and collaboration.
-
Collaboration & Sharing: Exploring the process of collaborating with others and sharing Power BI reports and dashboards.
-
Data Refresh & Security: Understanding how to set up scheduled data refresh and implement security measures in Power BI.
-
Discussion on Assignment (03) & more: Final discussions on assignments, exploring creative possibilities, common interview questions, and guidance on Power BI certifi
About This Course:
- Free IT Training
- Free Certification
- Free Interview Support
- Free Project Support
- Contact & Address
$1,000.00
Hi, Welcome back!